
As of version 1.3.1 there is a new coherence analysis in BreathTuner. It displays a direct visual comparison between your breathing curve and your heart rate curve.
For each breathing rate in a measurement or globally over all your measurements (different analysis pages) the two curves (breathing and heart rate) are displayed superimposed in time. A separate diagram is generated for each breathing rate and the individual diagrams are arranged one below the other.
Each diagram displays a heart rate and breathing curve averaged over all breaths. The superposition of the curves in time is an indication of the synchronization of respiration and heart (resonance frequency).
If the breathing rate is too fast for you, then the green breathing curve is shifted to the left compared to the red heart rate curve. If the breathing rate is too slow, then it is the other way around. At your optimal breathing rate, the two curves overlap without significant phase shift. The color-coded bar to the right of the curves visualizes this relationship. The further the pointer is in the green area, the better the breathing rate works for you.
To the right of the diagrams is the calculated coherence value. The higher this value, the closer the breathing rate is to your individual resonance frequency.
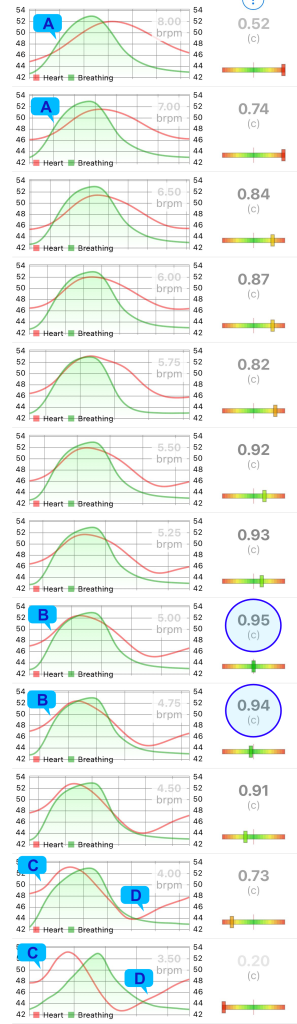
The page shows coherence diagrams for respiration rates from 8.0 to 3.5 breaths per minute (from top to bottom). The graphs summarize breaths from approximately 30 measurements taken by the subject.
It is easy to see that the heart rate curve moves from right to left depending on the breathing rate.
- A) Breathing is too fast (heart rate curve is lagging).
- B) Breathing and heart rate are well synchronized -> high coherence values. These breathing rates are close to your individual resonance frequency.
- C) Breathing is too slow (heart rate curve is running ahead).
- D) The heart rate begins to go up significantly before the end of the breath -> breathing is too slow.
The height of the heart rate curve – i.e. the difference between the maximum value and the minimum value in one breath – changes with the breathing rate. For the subject, this so-called “E-I difference” increases continuously as breathing slows.
The diagrams above are copied directly from the BreathTuner app.
BreathTuner automatically evaluates the correlation between your breathing curve and your heart rate curve and combines this coherence value with other (HRV) parameters to determine your personal best breathing rate.